Dashboard
5 minute read
Portfolio » Dashboard
A dashboard that learns what each user needs first
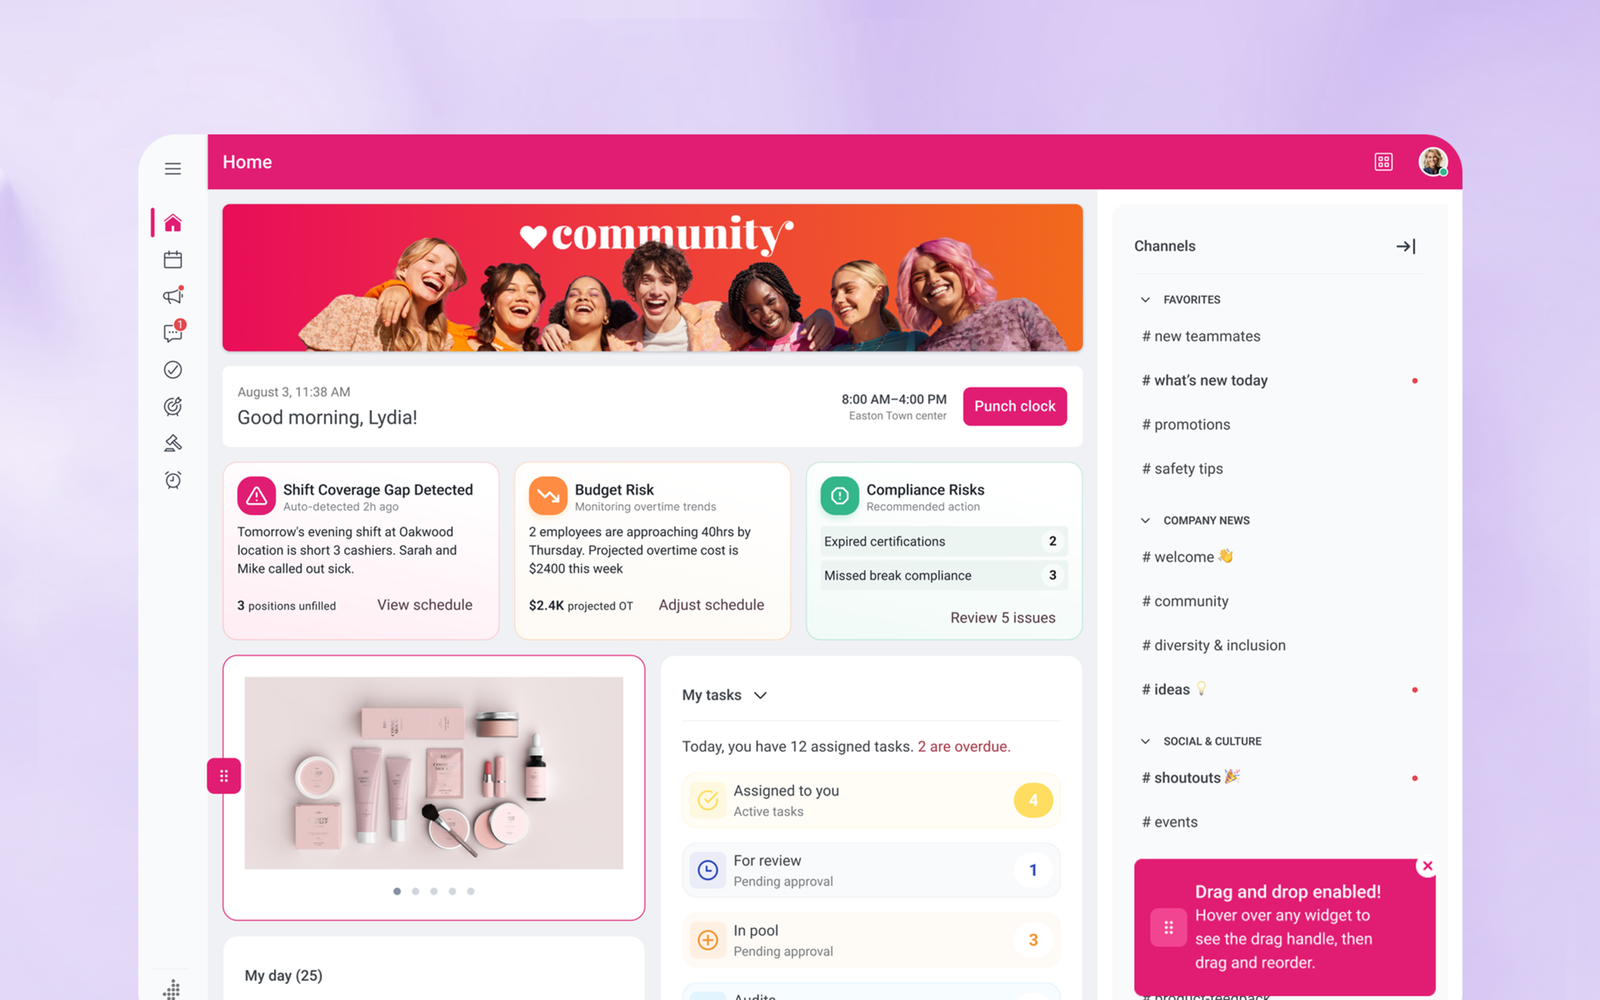
The short version
I was asked to modernize WorkJam’s dashboard. Before changing the interface, I questioned what the dashboard was helping people do.
The usage pattern pointed to a larger opportunity: users landed on the page and quickly navigated elsewhere. The dashboard was a starting point in the product, but it offered little reason to stay.
I reframed the work around a more useful purpose: help people understand what needs their attention and get to the next action faster. I translated that direction into a working prototype, built support with product and sales leadership, and helped shape a focused first release using existing data and components.
The problem: a dashboard people moved past
The original brief, “modernize the dashboard,” described a change in appearance. It did not define the user problem or what success would look like.
The dashboard had no support tickets. On its own, that could suggest the experience was working. Combined with analytics showing users leaving the page for other areas of the product, it raised a different question: was the dashboard useful enough for people to rely on?
I treated the lack of complaints as a reason to investigate, rather than evidence of success. The opportunity was to make the page valuable within the flow of someone’s work.
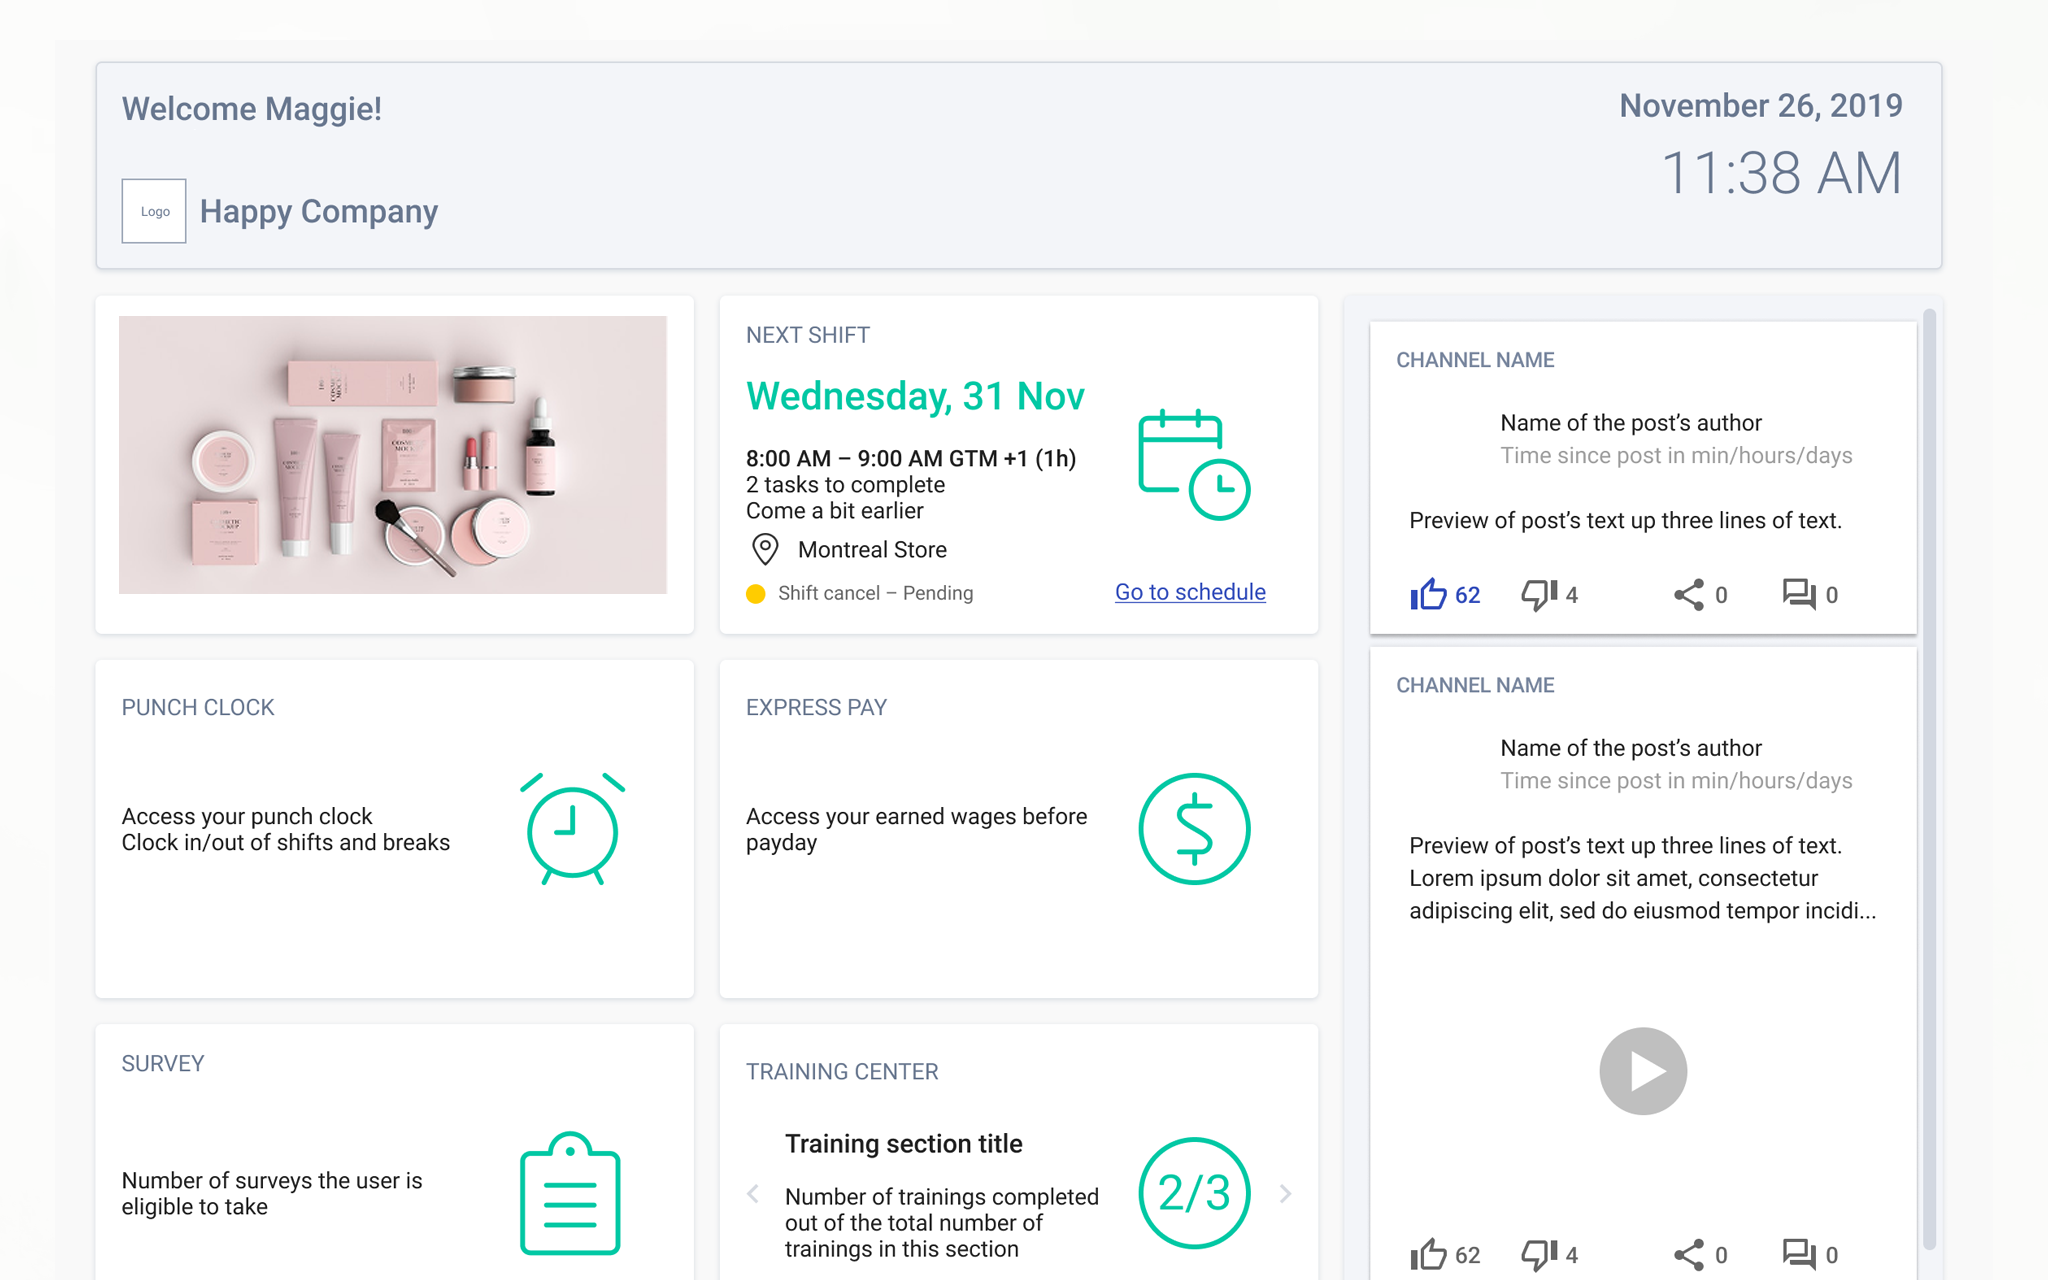
Strategic approach & collaboration
I identified the gap before a solution existed. Rather than inheriting the “modernize” brief at face value, I reframed the problem around decision-making, mapping manager behaviour and pulling usage analytics before a single screen was designed.
To make the vision tangible fast, I built a working prototype using v0 by Vercel and Lovable. Focused on one persona, built on existing platform data, with assistive AI surfacing risk signals directly in the interface. No new backend. No waiting for engineering.
I presented it to three audiences: VP of Product, Director of Sales, and Executive leadership, each framed around what they cared about most: platform strategy, competitive differentiation, and business outcomes.
What started as a subjective UI request became a formal 0→1 initiative with executive sponsorship, a 2.5-sprint plan, and full cross-functional alignment.
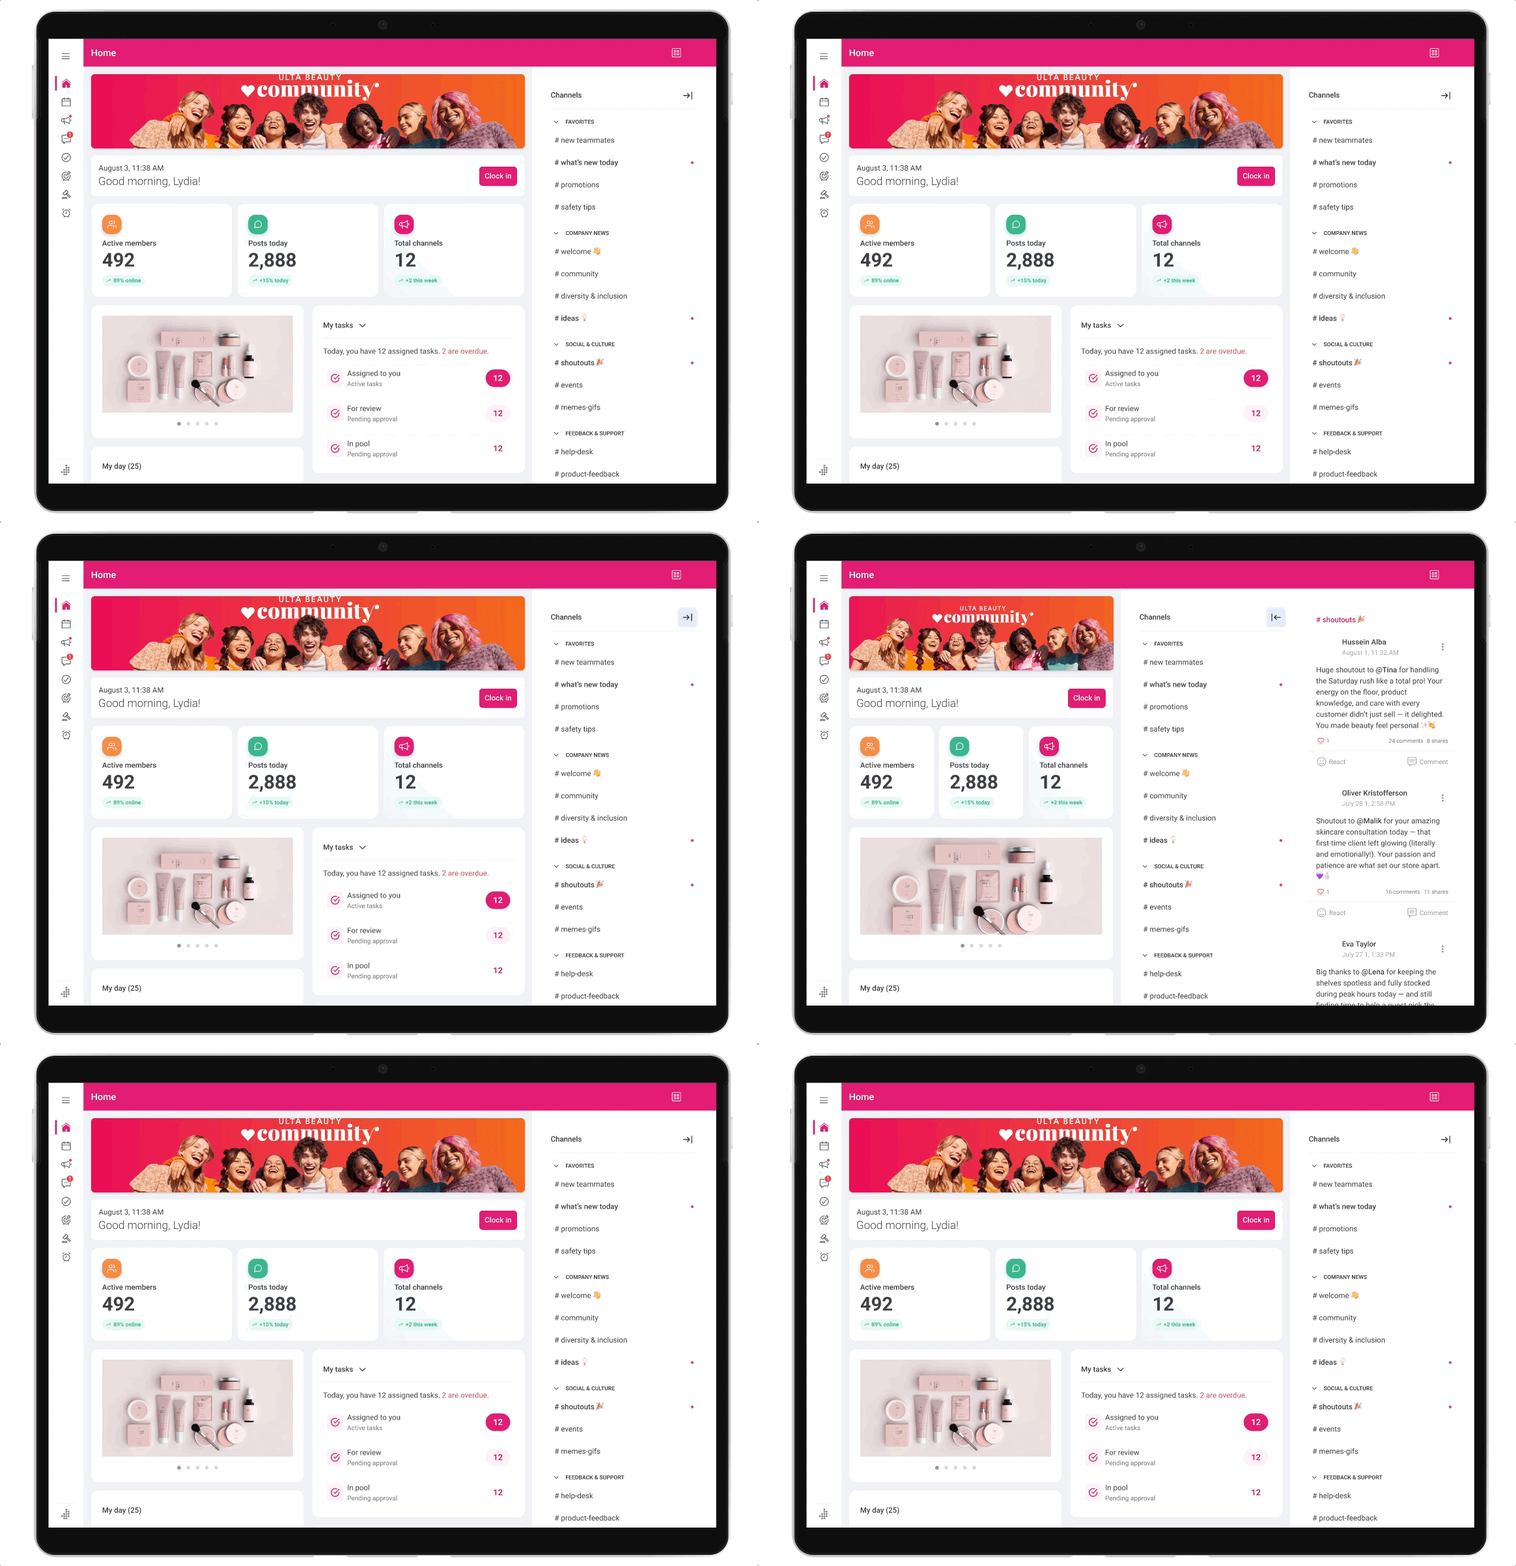
The solution: A modular decision surface
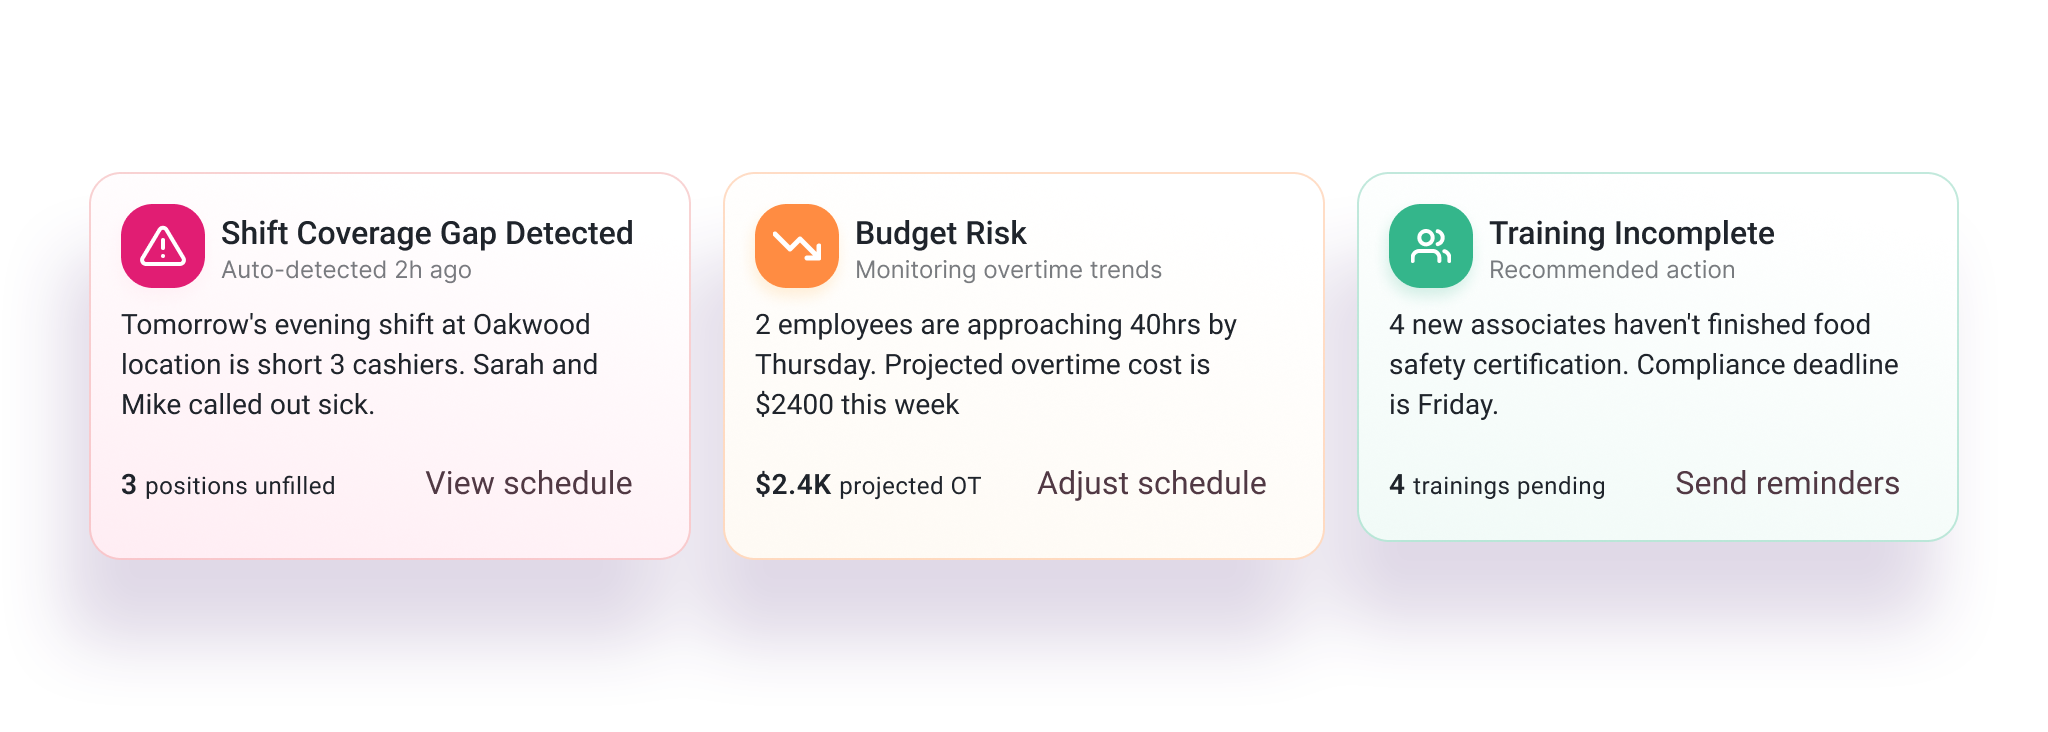
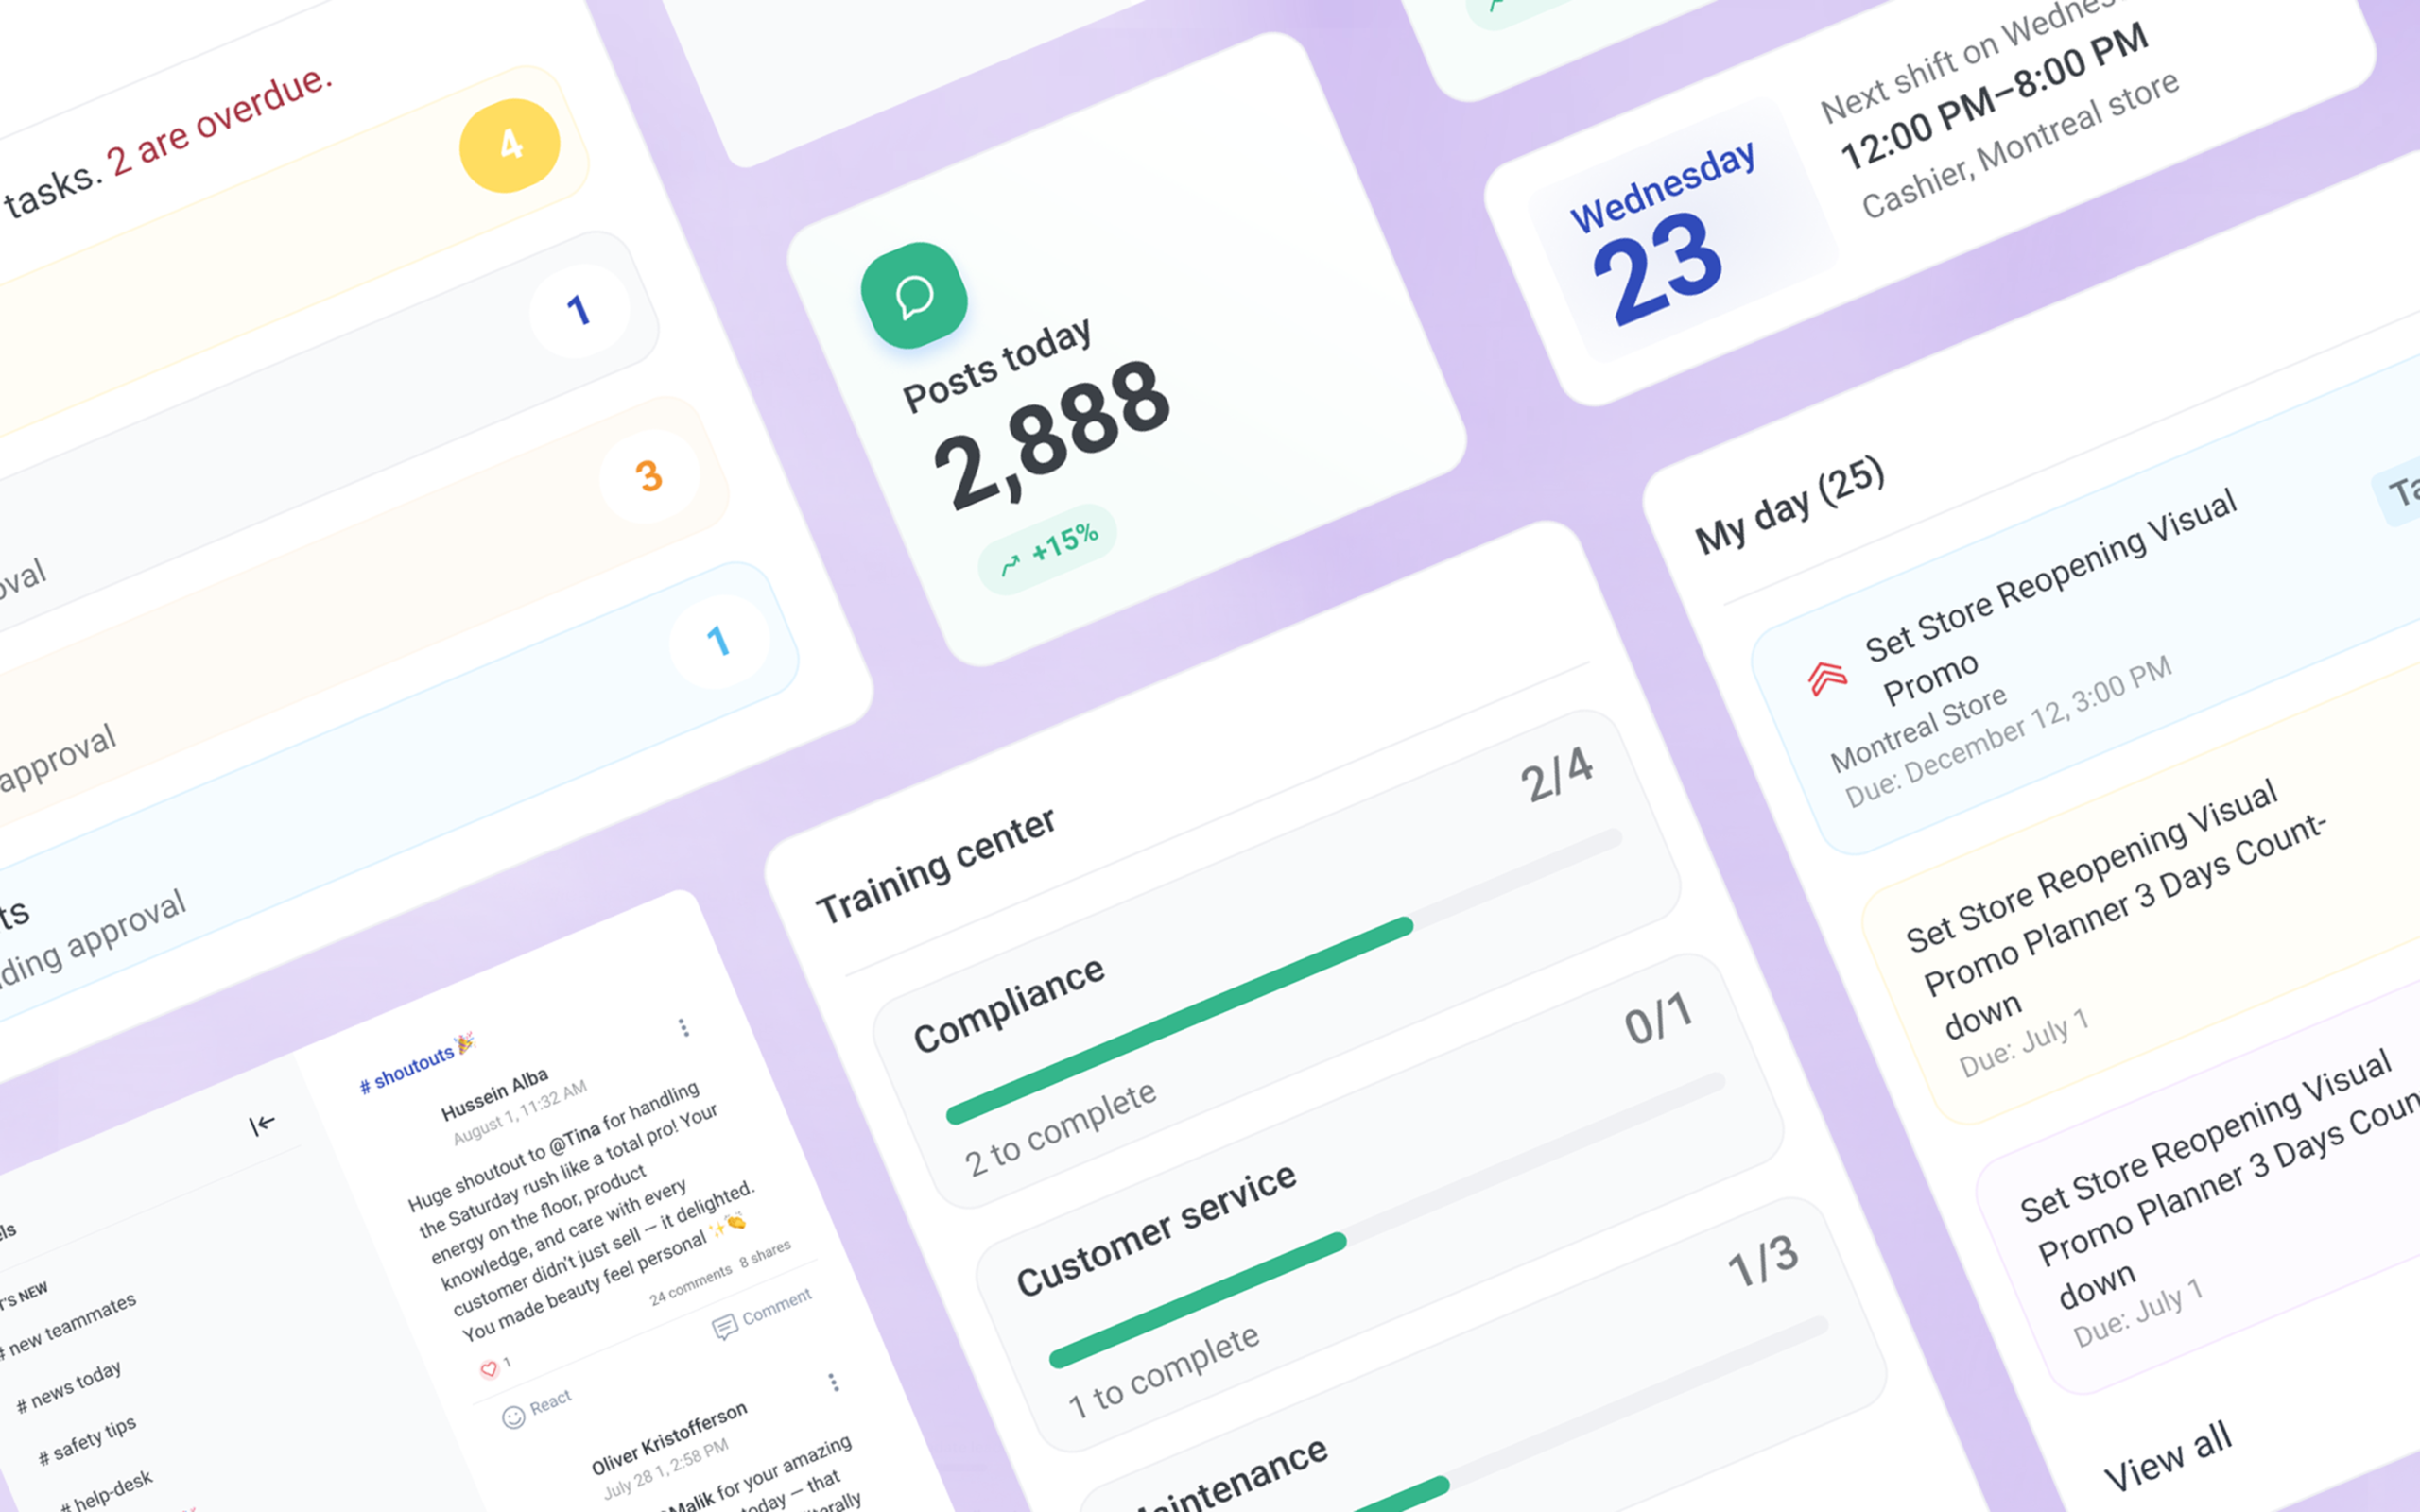
I delivered a 0→1 dashboard system that moved beyond static reporting into proactive decision support. Rather than presenting raw metrics, the dashboard prioritizes signals that indicate risk, opportunity, or required attention.
The core design challenge was deciding what deserved attention on the primary surface and what should stay out of the way, making deliberate choices about hierarchy, signal visibility, and when the interface should speak up versus stay quiet. The system was built modular from the start, so different personas could focus on what mattered to them without redesigning the foundation.
Design decision: Risk pattern
Two valid options: make risk always visible and risk alarm fatigue, or surface it only when triggered and risk managers missing it.
The job-to-be-done settled it. Managers come to the dashboard to answer one question: “What needs my attention right now?” Risk needed to be findable without being loud.
The solution was a hybrid: a consistent attention area that stayed in the layout but only expanded when thresholds were triggered (late punches, unapproved timecards, coverage gaps). Validated through manager feedback, prototype click behaviour, and engineering feasibility.
Quantifiable impact
Competitive
impact
Became the hero experience in enterprise sales demos, helping visualize the platform’s future-state intelligence and improving win confidence.
80%+
adoption rate
Adoption was immediate across active accounts, elevating the dashboard from a “nice to have” to an active, multi-phase roadmap initiative.
~10
minutes saved
Managers could quickly understand workload, risk, and priorities without manually scanning multiple sections or reports.
Scalable
foundation
The system was built to scale from today’s operational insights to future intelligent guidance as usage patterns evolve.
How we validated these results
Impact was informed through a combination of product analytics, internal benchmarks, and qualitative feedback from managers and go-to-market partners during rollout and sustained usage. Results reflect aggregated patterns observed across roles and workflows rather than isolated outcomes.
Why this matters
This dashboard established a decision-support foundation that later enabled deeper operational experiences, including Manage Schedule. By treating the dashboard as an entry point for understanding risk and opportunity, subsequent features were able to act as focused decision layers rather than isolated tools.
Together, these initiatives reflect a consistent platform strategy: turning complex, interconnected data into clear, actionable guidance at the moment decisions are made.
* A note for recruiters & hiring managers
This case study is a high-level overview of my process in navigating ambiguity and driving cross-functional alignment. To keep this scannable, I’ve omitted the granular details of the technical architecture, iterative prototyping, and specific accessibility audits.
I would be happy to walk you through a deep dive of this project during a 1:1 interview.
Quick wins
Exposed hidden constraints as actionable signals
Previously invisible operational constraints were surfaced directly in context, helping managers understand why certain metrics or risks mattered. This reduced reactive investigation and enabled faster, more confident decisions without adding new data sources.
Turned the dashboard into a coordination layer
Rather than functioning as a standalone reporting surface, the dashboard became a coordination point across operational domains. Signals from staffing, compliance, and workload were translated into a shared decision context, unlocking value from existing systems without requiring structural changes.
Reduced reliance on manual workarounds
By prioritizing clarity and early risk visibility, the dashboard addressed common reasons managers relied on spreadsheets or offline tracking. This helped restore trust in the platform as the primary source for operational insight.
Improved time-to-decision without adding complexity
Focused on surfacing only the most relevant signals at the right moment, allowing managers to act quickly without navigating deeper configuration or secondary reports.
Role
Roadmap influence
Product strategy
UX architecture
UX and UI
Team & Partners
VP of product • Sponsor
Dir. of sales • Strategy
Architect • Logic
Lead engineer • Dev
Senior designer • Lead
Duration
- Phase 1: 2 Sprints (MVP)
- Phase 2: In Development (Scalable framework)